RAC_ASM Monitoring:
As the application is taken into production, it grows and
flourishes. That can be a big burden for the DBA if he is not proactively
monitoring his database. There could be several causes for this growth: disk
usage might go up, network bandwidth might bottleneck, transactions may start
taking too long to commit, more users and more aggressive usage. This may be
good for the business but the Service
Level Agreements (SLAs) still need to be met. Proactive monitoring your
Oracle RAC or even a typical single node Oracle database will keep you upwind
of problems. However, that means you need to know which tools you should be
using to do just that.
What are we monitoring?
The questions below can assist a DBA to optimize his routine administration tasks as well as help management make timely decisions.
1. Are we meeting our SLA
(Service Level Agreements)?
2. Are the High Availability
(HA) objectives being met?
3. Are all instances sharing
the load evenly?
4. What is the interconnect
load (latency/overhead)?
5. CPU: Are Oracle processes
getting enough resources?
6. Memory: How is the memory
for System Global Area (SGA) etc?
Questions similar to these, broken up to monitor at all levels
(Application, Database, OS, and HW), help a DBA to monitor the RAC environment
efficiently and effectively.
è At hardware level:
Disks, HBAs, NICs, cabling, backup devices etc. need to function
properly. All these devices need to be configured properly.
è At OS level:
You need to monitor the CPU, Memory, Disk performance and Network traffic.
CPU (%idle time, etc.)
I/O (queue length)
Shared storage
network (both public and private network)
memory (paging, swapping, etc.)
logs (var/log/messages etc)
è At Database level:
You have to monitor all the cluster logs, event logs, asm logs and rdbms logs at your database level.
Cluster (ORA_CRS_HOME) and all related log files:
CRS alert log file
CRS logs: log/hostname/crsd
CSS logs: log/hostname/cssd
EVM logs: log/hostname/evmd & /log/hostname/evm/log
SRVM logs: log/hostname/client
OPMN logs: opmn/logs
Resource specific logs - /log/hostname/racg
ORACLE_HOME
Resource spec logs - /log/hostname/racg
SRVM logs- log/hostname/client
ASM
alert_SID.log : location: ORACLE_HOME/rdbms/log
Trace files:
bdump - background_dump_dest
cdump - core_dump_dest
udump - user_dump_dest
listener_<NODE>.log : ORACLE_HOME/network/log
è
Application Level:
At Application level, we need to carefully sprinkle the monitoring code
(for instance, if the application server were a Tomcat Server or JBoss, then
you would be interested in all of the Catalina logs, java.util logs or log4J
logging, etc). There are tools, which are more professional, like BIRT, which
can be employed to monitor your application’s performance.
The Toolkit à
For the OS you will need the following tools:
TOP à Top Processes
PS à Status of the
processes
IOSTAT à I/O stats
VMSTAT à Virtual Memory
stats
NETSTATà Network stats
IPCFG/IPCONFIG à Checking IP
address locally on nodes
PING à Utility to ping
across nodes
TRACERT à TRACERT is useful
for troubleshooting large networks where several paths can be taken to arrive
at the same point, or where many intermediate
systems (routers or bridges) are involved.
NSLOOKUP à Ping IP addresses
using DNS to lookup the nodes
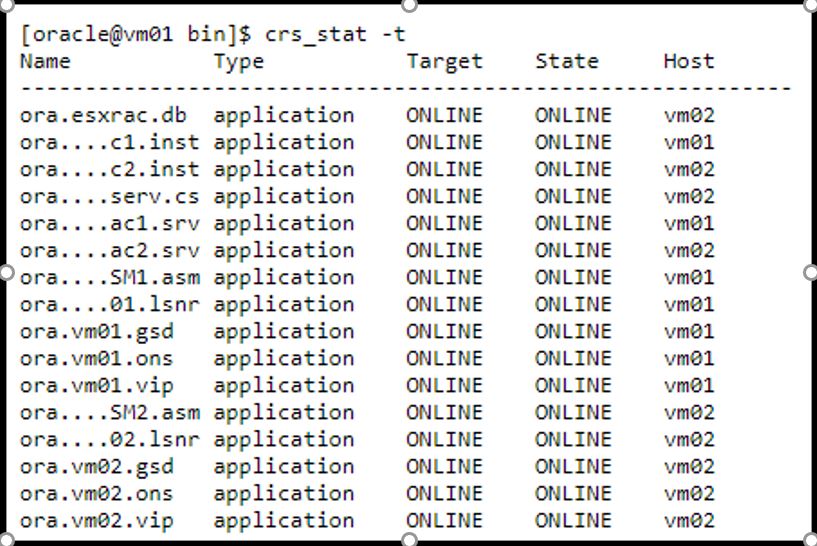
CLUSTER CHECK à
$ crs_stat -t
IOSTAT AT INTERVALS OF 3 SECONDS à
$ iostat -t 3


Here sda, sdb are the files
for OS installation and swap. Sdc, sdd and sde are the files used for OCR,
Votingdisk and Spfileasm respectively. Sdf and Sdg are the files we chose for
oradata (where all of our Oracle data files are residing) and sdh is for the
flashback recovery. You can clearly see that iowait is considerably low, which
is a good thing--had it been higher you would be looking at an I/O bottleneck.
On the disks (devices section) you can clearly see that our cluster is doing
fine but the oradata disks are working hard (and rightly so!). That is why I
explained earlier that I have optimized my test scenario on the DAS to have
more advantage on the spindle speed, seek time and throughput. The oradata
files are on a separate disk. After getting your disks and data all evenly
spread out, you can use the –x parameter to get additional useful information,
such as average request size, average wait time for requests and average
service time for requests.
Let’s run it
with –x parameter à
$ iostat –x

è
By checking the status of individual nodes and
all the necessary applications, we can see that the VIP, GSD, Listener and the ONS daemons are alive.
$ srvctl
status nodeapps -n vm01
$ srvctl
status nodeapps -n vm02

è
Now checking the status of the ASM on both
nodes...
$
srvctl status asm -n vm01
$
srvctl status asm -n vm02

è
What about the database status?
$ srvctl
status database -d esxrac

è
What would be the status of the service that we
created at the end of the database installation?
$ srvctl
status service -d esxrac

è
Cluster Status
$ crsctl
check crs

è
Querying the RAC
SQL>
select instance_name, host_name, archiver, thread#, status from gv$instance;

è
Checking the SGA (System Global Area) on one of
the nodes (Note: Both nodes have identical setup).
SQL>
show sga

è
Getting a list of all our datafiles...
SQL>
select file_name, bytes/1024/1024 from dba_data_files;

è
Getting the status of all the groups, type,
membership (if any)...
SQL>
select group#, type, member, is_recovery_dest_file from v$logfile order by
group#;

è
Querying the v$asm_diskgroup view..
select
group_number,name,allocation_unit_size
alloc_unit_size,state,type,total_mb,usable_file_mb from v$asm_diskgroup;

è
Querying v$asm_disk for our volumes (remember the
ones we created first on OS level with the asmlib) :
select name, path, header_status,
total_mb free_mb, trunc(bytes_read/1024/1024) read_mb,
trunc(bytes_written/1024/1024) write_mb from v$asm_disk;

è
All files in one go:
select name from
v$datafile union select name from v$controlfile union select name from
v$tempfile union select member from v$logfile;

è Listing
all the tablespaces...
select tablespace_name, file_name from
dba_data_files union select tablespace_name, file_name from dba_temp_files;

è This
script will give you information of the +ASM1 instance files:
select group_number, file_number,
bytes/1024/1024/1024 GB, type, striped, modification_date from v$asm_file where
TYPE != 'ARCHIVELOG';

More detailed information:
select group_number, file_number,
compound_index, incarnation, block_size, bytes/1024/1024/1024 GB, type,
striped, creation_date, modification_date from v$asm_file where TYPE !=
'ARCHIVELOG';

è
UNIX
Basics for the DBA
Basic UNIX Command :
The following is a list of commonly
used Unix command:
PS à Show process
GREP à Search
files for text patterns
MAILX à Read or send mail
CAT à Join files or display them
CUT à Select columns for
display
AWK à Pattern-matching
language
DF à Show free disk space
è List available instances on a server:
$ ps -ef
| grep smon

è
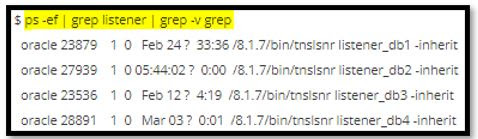
List
available listeners on a server:
$ ps -ef
| grep listener | grep -v grep
è
Find out
file system usage for Oracle archive
destination:
$ df -k |
grep oraarch

è
List
number of lines in the alert.log file:
$ cat
alert.log | wc –l

CRONTAB
BASICS à
A crontab file is comprised of six
fields:
|
Minute |
0-59 |
|
Hour |
0-23 |
|
Day of month |
1-31 |
|
Month |
1 - 12 |
|
Day of Week |
0 - 6, with 0 = Sunday |


No comments:
Post a Comment